


The sun’s solar activity has little effect on global warming, NOAA report highlights


Climate data in a report published by the National Oceanic and Atmospheric Administration’s (NOAA) Climate.gov website found that the sun’s solar activity, including overall brightness and sunspot cycles, do not have significant affect on global warming.
The report also said Earth’s next ice age may be postponed at least another 10,000 years due to rising amounts of atmospheric carbon dioxide (CO2) despite the solar activity findings.
The report published June 27 said multiple factors have contributed to global warming since the start of the industrial period (post 1900), however, the sun’s overall brightness and sunspot cycles, when measured during the industrial period, have not added substantial warming to the planet and cannot be fully attributed as a sole driver of global warming.
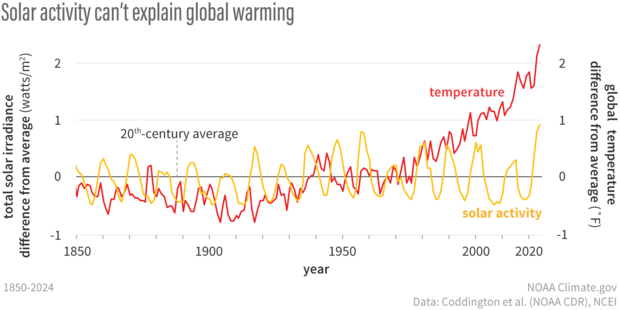
Yearly total solar irradiance (yellow line) and the annual global temperature (red line) from 1850–2024, each compared to the 20th-century average (solid black line) from 1880–2020. Since the middle of the 20 th -century, solar activity has declined while global temperature increased rapidly. NOAA Climate.gov image, based on solar data from Coddington et al., 2017, and temperature data from NOAA NCEI.
Courtesy, NOAA Climate.gov


Yearly total solar irradiance (yellow line) and the annual global temperature (red line) from 1850–2024, each compared to the 20th-century average (solid black line) from 1880–2020. Since the middle of the 20th-century, solar activity has declined while global temperature increased rapidly. NOAA Climate.gov image, based on solar data from Coddington et al., 2017, and temperature data from NOAA NCEI.
What the sun’s brightness, solar cycles and sunspots say about global warming effects
According to the report, changes in the sun’s overall brightness since the pre-industrial period (1850-1900) have contributed no more than 0.01 degrees Celsius of warming on Earth compared to the roughly 1 degree Celsius of warming that has happened over the industrial period.
The report pointed out that the sun’s energy output changes over multiple time scales, however, the most regular solar activity pattern, and the most important to humans, is an 11-year cycle of maximum (many sunspots) and minimum (few sunspots) solar activity caused by a reversal of the sun’s magnetic poles.
During strong cycles, the sun’s total brightness at the solar maximum is about 0.1% higher than during its solar minimum, but when averaged out over the industrial period, the sun’s total brightness fluctuation had a minimal effect on Earth’s global warming.
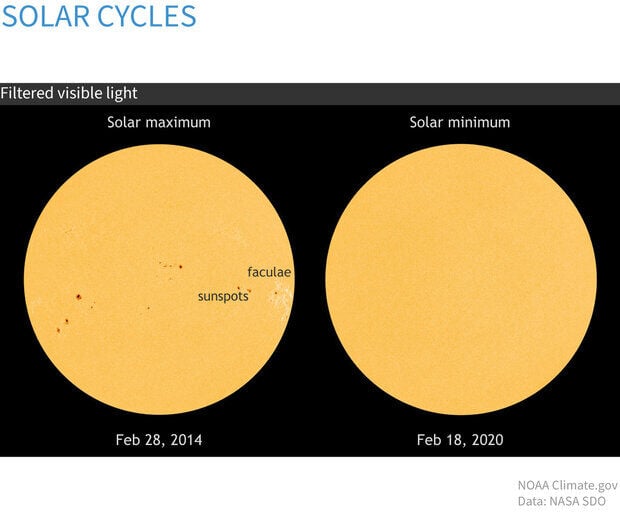
Intensitygrams—images of the Sun in filtered visible light—based on data from NASA's Solar Dynamics Observatory telescope on February 28, 2014, (left), near the maximum of the last solar cycle, and on February 18, 2020 (right), near the solar minimum. Dark patches called sunspots are easier to see than their companion faculae, diffuse bright areas that contribute to making the Sun slightly brighter during solar maximum. Images from NASA SDO.
Courtesy, NOAA Climate.gov


Intensitygrams—images of the Sun in filtered visible light—based on data from NASA’s Solar Dynamics Observatory telescope on February 28, 2014, (left), near the maximum of the last solar cycle, and on February 18, 2020 (right), near the solar minimum. Dark patches called sunspots are easier to see than their companion faculae, diffuse bright areas that contribute to making the Sun slightly brighter during solar maximum. Images from NASA SDO.
The report said when averaged over the solar cycle period, the best estimate of the sun’s overall brightness change between the pre-industrial period and the present (circa 2019) was 0.06 Watts per square meter, meaning this increase from the sun’s energy could only be responsible for approximately a 0.01 degrees Celsius temperature increase, or about 1%, of the warming Earth has experienced over the industrial era.
Current temperature increases of between 0.95 to 1.2 degrees Celsius have been recorded from the period between 2011–2020. When compared to the time frame between 1850–1900, global temperature increases did not exceed those values.
According to the report, sunspot records showed increased solar activity during the first seven decades of the 20th century, following a peak around 1960.
However, solar activity had declined since then and that activity during the most recent solar cycle was among the lowest in a century. Meanwhile, the rate of global warming has accelerated over the past few decades.
The report said another factor that would have little affect on global warming was a strong, multi-decade long Grand Solar Minimum — a period of reduced solar activity where solar cycles exhibit lower-than-average intensity for decades or centuries.
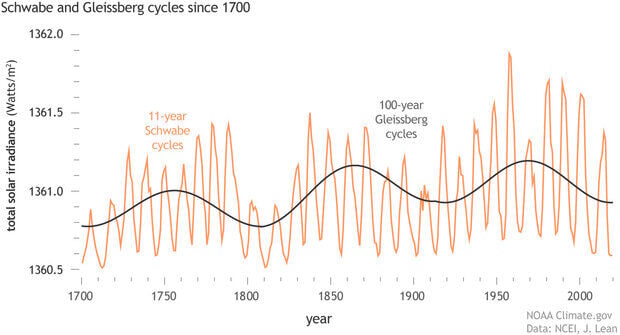
The amplitude of the 11-year solar cycle (formally called the Schwabe cycle, orange) is modulated by the approximately 100-year Gleissberg cycle (charcoal), in which a number of consecutive cycles of high activity are bracketed by consecutive cycles of lower activity. The start of the Industrial Revolution in the mid-1700s coincided with a Gleissberg maximum. The relatively high activity of the mid 20th-century also coincided with a Gleissberg maximum, while the recent decades coincide with a Gleissberg minimum. NOAA Climate.gov image based on data from Wang and Lean, 2021.
Courtesy, NOAA Climate.gov


The amplitude of the 11-year solar cycle (formally called the Schwabe cycle, orange) is modulated by the approximately 100-year Gleissberg cycle (charcoal), in which a number of consecutive cycles of high activity are bracketed by consecutive cycles of lower activity. The start of the Industrial Revolution in the mid-1700s coincided with a Gleissberg maximum. The relatively high activity of the mid 20th-century also coincided with a Gleissberg maximum, while the recent decades coincide with a Gleissberg minimum. NOAA Climate.gov image based on data from Wang and Lean, 2021.
A Grand Solar Minimum would not be able overpower the amount of global warming projected for the coming century, meaning the planet couldn’t cool via this kind of solar cycle from the sun either.
The report said in one climate modelling experiment published in 2013, scientists explored the impact on global warming if a Grand Solar Minimum strong enough to reduce total solar irradiance by 0.25% were to begin in 2025 and last through 2065.
However, to reach a 20% reduction in global warming, a Grand Solar Minimum would have to be very strong, meaning sunlight at the top of the atmosphere would need to drop by nearly 6 Watts per square meter.
When will the next ice age begin?
According to the report, the 11-year sunspot cycle and its Gleissberg-cycle modulation — long-term variations in Earth’s climate caused by cyclical changes in Earth’s orbit and axial tilt with predictable orbital patterns repeating regularly over tens to hundreds of thousands of years — causes small changes in the sun’s actual brightness.
Earth’s climate is also affected by how much sunlight reaches the planet due to changes in its orbit and position in space relative to the sun. These changes are called Milankovitch cycles, which are predictable orbital patterns repeating times of tens to hundreds of thousands of years.
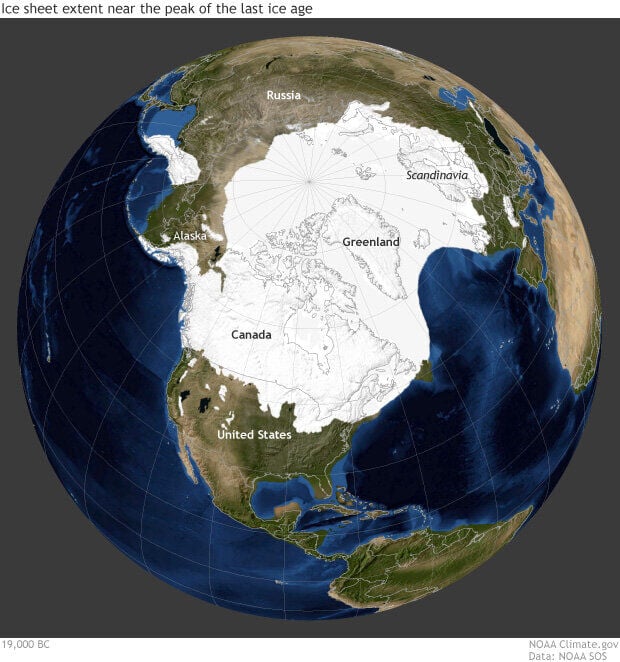
Roughly 20,000 years ago, during the Last Glacial Maximum of the Pleistocene Ice Age, ice spread over much of North America and Eurasia. Image by Climate.gov , based on data from the University of Zurich Applied Sciences , provided by Science on a Sphere.
Courtesy, NOAA Climate.gov


Roughly 20,000 years ago, during the Last Glacial Maximum of the Pleistocene Ice Age, ice spread over much of North America and Eurasia. Image by Climate.gov, based on data from the University of Zurich Applied Sciences, provided by Science on a Sphere.
However, the report also said Milankovitch cycles have coincided with 100,000-year-long ice ages punctuated by short intervals of rapid warming.
The report said the key climate influence in the Milankovitch cycles seem to be changes in the amount of incoming sunlight, or insolation, reaching the high latitudes of the Northern Hemisphere during the summer.
Because the Northern Hemisphere is key to the ice ages, massive ice sheets can only grow over land, not ocean, and most of Earth’s land area has been concentrated in the Northern Hemisphere.
The most significant changes in Northern Hemisphere insolation come from three variations in Earth’s orbit:
- Precession (~26,000 years): the slow rotation or “wobble” in the Earth’s axis of rotation, which changes where in the annual orbital path Northern Hemisphere summer solstice occurs.
- Obliquity (~41,000 years): how tilted Earth’s axis of rotation is.
- Eccentricity (~100,000 years): how far Earth’s orbit is from being a perfect circle.
The report said that how low summer insolation must fall to trigger an ice age depends on how high atmospheric CO2 levels are; the more carbon dioxide, the lower the insolation must be.
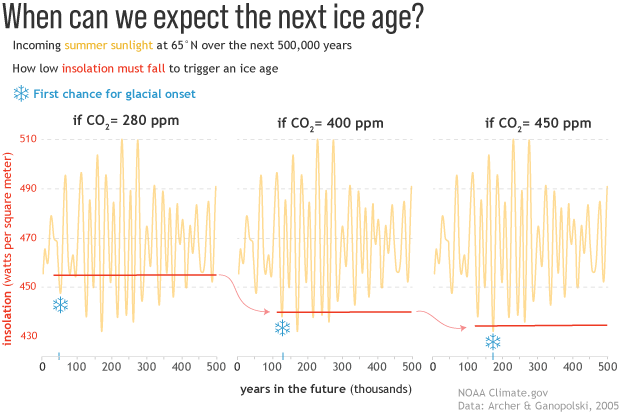
Yellow lines show changes in incoming sunlight in the Northern Hemisphere due to Milankovitch cycles over the next 500,000 years. (l eft panel ) At pre-industrial levels carbon dioxide levels of around 280 parts per million (ppm), insolation must drop below about 455 watts/m 2 (red line) to trigger an ice age, a threshold that will be reached around 50,000 years from now (blue snowflake). The higher the atmospheric carbon dioxide level, the lower the insolation has to fall to trigger an ice age, delaying the possibility for the next ice age by tens of thousands of years ( center panel ) or more ( right panel ). NOAA Climate.gov graphic, based on data from Archer and Ganopolski, 2005.
Courtesy, NOAA Climate.gov


Yellow lines show changes in incoming sunlight in the Northern Hemisphere due to Milankovitch cycles over the next 500,000 years. (left panel) At pre-industrial levels carbon dioxide levels of around 280 parts per million (ppm), insolation must drop below about 455 watts/m2 (red line) to trigger an ice age, a threshold that will be reached around 50,000 years from now (blue snowflake). The higher the atmospheric carbon dioxide level, the lower the insolation has to fall to trigger an ice age, delaying the possibility for the next ice age by tens of thousands of years (center panel) or more (right panel). NOAA Climate.gov graphic, based on data from Archer and Ganopolski, 2005.
According to the report, another study estimated that at pre-industrial CO2 levels, summer insolation at 65° North need only dip 0.75 standard deviations below the mean for summers to be too cool to melt all the winter snow.
Furthermore, at 400 parts per million, summer insolation would need to fall twice as much to a low that Earth will next see 125,000 years from now.
The study also said if atmospheric CO2 levels were to jump above 560 parts per million, Earth’s next ice age is not likely to occur within the next half million years as no Milankovitch cycle variations will be low enough to trigger an ice age.
(Contact Denver Gazette Digital Strategist Jonathan Ingraham at [email protected] or on X at @Skingraham.)